Opinionated Agents Ship Faster
Why convention over configuration — the principle that powered Rails, Vercel, and Cloudflare — matters even more when the developer isn't human.

Disclosure: I’m a Cloudflare employee and shareholder. Opinions expressed here are my own and do not represent the views of Cloudflare.
Editor’s note (March 2026): Since writing this, I’ve replaced the monitoring container with a VM. What I described as a peripheral SSH quirk turned out to be a symptom of a deeper LXC limitation — unprivileged containers have unreliable SSH access and systemd dropouts that make them the wrong foundation for always-on infrastructure. If you’re building this stack, start with a VM. Everything else in this post holds.
I didn’t plan to have a comprehensive observability stack at home. I had several Linux containers running on a virtualisation host, AI agents generating logs around the clock, and a growing realisation that I was flying blind.
The prompt was deliberately vague — something about needing observability of the infra and systems that run my house and homelab. I didn’t name any tools. I didn’t suggest an approach. I wanted to see what would happen if I gave the OpenClaw agent that I’d designated my personal assistant the problem and nothing else.
No architecture diagram. No tool selection meeting. No Jira ticket. Just a goal and some trust.
What happened next took under 2 hours and minimal intervention on my part — I had to step in a couple of times to escalate permissions and work around an SSH issue, but the agent drove the process end to end.
This is the part that feels counterintuitive. I’m an infrastructure guy. I could have specified tooling that I already know; I have opinions about observability stacks, though I’m 2 years out of working directly in the space and a lot can change in that time.
But that would have missed the point.
The interesting question isn’t whether an AI agent can follow a runbook. It’s whether it can make reasonable technical decisions when given a goal instead of a checklist. Can it survey an environment, understand what’s running, choose appropriate tools, and wire everything together?
So I stepped back and let it work.
The agent started by querying the hypervisor’s API — it already had access from earlier work. Within minutes, it had a complete inventory of the virtualisation host and every container and VM running on it.
A mix of workloads — AI agents, a home security camera recorder, utility boxes — each with different resource profiles. All needing visibility.
The agent came back with a proposal before touching anything:
Nothing exotic. Nothing bleeding-edge. Just tools that work. It picked battle-tested software that composes well, is well-documented, and runs comfortably on modest hardware. Not the stack I would have chosen — I’d never tried Loki, Promtail, or Node Exporter before.
First, it needed a home. The agent called the hypervisor API and provisioned a new container — 2GB RAM, dedicated to monitoring. A separate box, isolated from the workloads it watches.
Then the deployment sequence:
1. Node Exporter everywhere. The agent connected to each container and installed Node Exporter. It also deployed it on the hypervisor host itself — a must.
2. Prometheus on the monitoring container. Configured with scrape targets for every machine it discovered, plus itself. All reporting UP on the first try.
3. Grafana alongside Prometheus. Imported the Node Exporter Full dashboard, and created a service account with an API key so it could manage dashboards programmatically going forward.
4. Loki for logs. This is where it got interesting. The agent didn’t just install Loki — it configured 90-day retention and set up Promtail on every container running OpenClaw. Agent logs, structured and searchable, flowing into a central store.
5. Promtail on each agent container. AI agents got Promtail instances, configured to ship OpenClaw logs to Loki with appropriate labels.
The whole thing was done in a single session. I stepped in twice — once to upgrade the agent’s API token permissions so it could provision containers, and once to help work around the SSH issue on the monitoring box. Both times, the agent told me exactly what to type. I copied and pasted its suggested commands into the shell. I didn’t need to think about what I was running — though I’ll admit I read each one before hitting enter. Old habits. Everything else was autonomous. The agent used the hypervisor API for container management and direct SSH for in-container work.
Not everything was smooth.
SSH into the monitoring container turned out to be unreliable — some interaction between authentication methods and DNS resolution that made connections flaky. Rather than spending hours debugging a peripheral issue, the agent documented the workaround: use the hypervisor’s exec command to shell into the container, or manage Grafana through its API.
This is the kind of pragmatic decision I appreciate. It didn’t block on a perfect solution. It found a path that works, documented why, and moved on.
The difference between “probably fine” and actual visibility is stark.
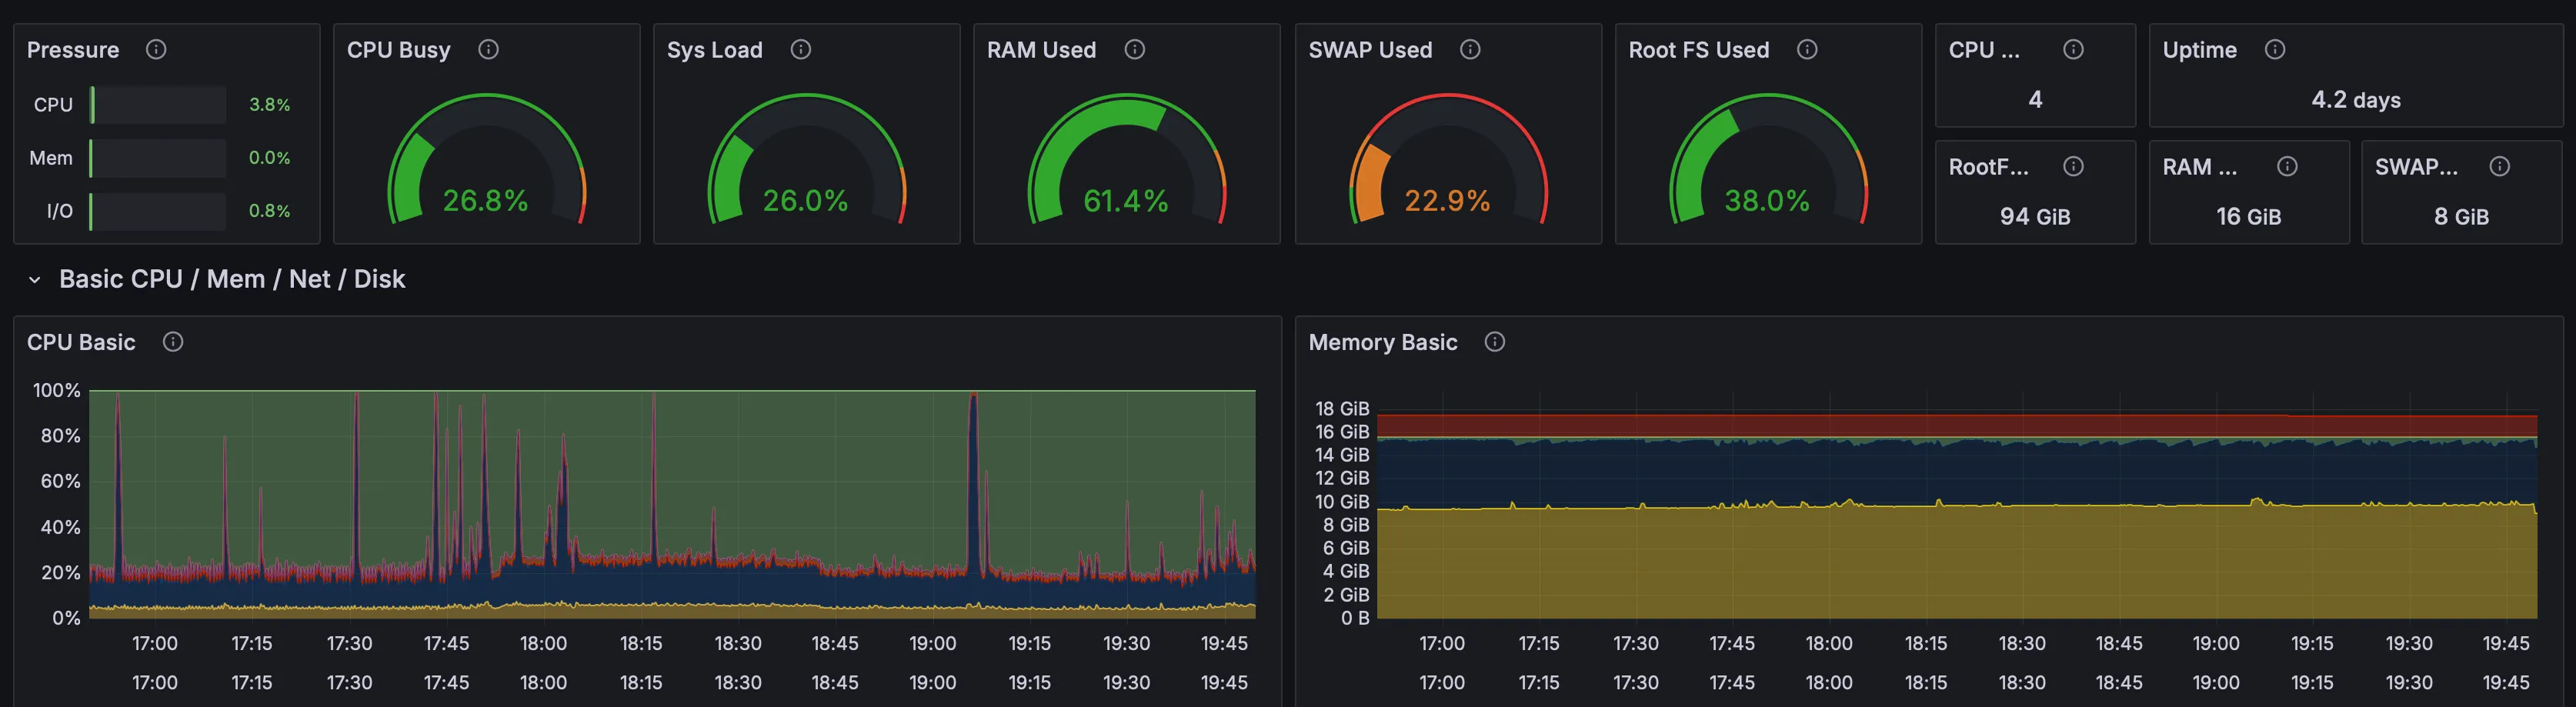
From a single Grafana dashboard, I can see CPU, memory, disk, and network across every container and the host. I can see that the NVR is chewing through its dedicated storage volume. I can see that the OpenClaw agents are surprisingly modest in their resource usage. I can see the host’s load patterns throughout the day.
And with Loki, I can search agent logs. What did the agent do at 3am? Pull up the logs. Did the backup job succeed? Check the structured output. When something goes wrong at 2am, I don’t have to SSH into boxes and grep through files — it’s all in one place.
I want to be careful about claims here. This isn’t artificial general intelligence. It’s not even particularly novel — plenty of DevOps engineers could set this up in an afternoon.
But that’s exactly the point.
The agent did competent infrastructure work. It assessed an environment, made reasonable tool choices, handled a deployment across multiple machines, worked around problems, and documented everything. It didn’t need a playbook. It needed a goal.
The shift isn’t from “impossible” to “possible.” It’s from “I need to find an afternoon” to “it’s already done.” For a solo operator managing a homelab — or a small team managing production infrastructure — that shift matters.
There’s a spectrum here that I’ve been thinking about increasingly:
This project sat firmly at level two. I provided the strategic direction (we need monitoring), and the agent handled the tactics (which tools, which targets, which configuration). I didn’t have to review Prometheus scrape configs or debate Loki retention periods.
Level three is where it gets genuinely interesting. An agent that notices its own observability gap and proposes filling it. Looking beyond infra and systems, Alex Finn claims that his agent fleet has been proactively driving revenue growth for his business — as he put it on X: “My autonomous agent has now shipped multiple new features to Creator Buddy by itself”.
The monitoring container uses about 2GB of RAM and minimal CPU. Prometheus, Grafana, Loki, and Promtail all run on free, open-source software. The only real cost is the disk space for metrics retention (90 days) and log storage.
On a homelab that was already running, the marginal cost is effectively zero.
Honestly? Not much. But there are things I want to add:
If this works for a solo homelab operator, imagine what it means for teams stuck in month-long implementation cycles.
The barriers between intention and execution are falling fast. But autonomy without accountability is just risk with extra steps. The challenge ahead isn’t whether to trust agents — it’s how we introduce governance and guardrails without stifling the autonomy that makes them useful in the first place.
What becomes the bottleneck when the doing happens at the speed of thinking?
Agentically co-authored.

Why convention over configuration — the principle that powered Rails, Vercel, and Cloudflare — matters even more when the developer isn't human.

Agentic life insurance — how I built encrypted, automated backups for my AI assistant using Cloudflare R2, rclone, and age encryption so I'd never lose him